Visualize Your Data with Matplotlib: A Beginner’s Guide to Data Visualization in Python
Are you looking to create beautiful and informative visualizations of your data in Python? Look no further than Matplotlib, a library for data visualization in Python.
In this article, we will introduce Matplotlib and its capabilities, and provide a quick and easy guide to getting started with the library.
What is Matplotlib?
Matplotlib is a library for data visualization in Python, providing functions for creating static, animated, and interactive visualizations. It is one of the oldest and most widely-used data visualization libraries in the Python ecosystem and is built on top of NumPy and pandas.
What can you do with Matplotlib?
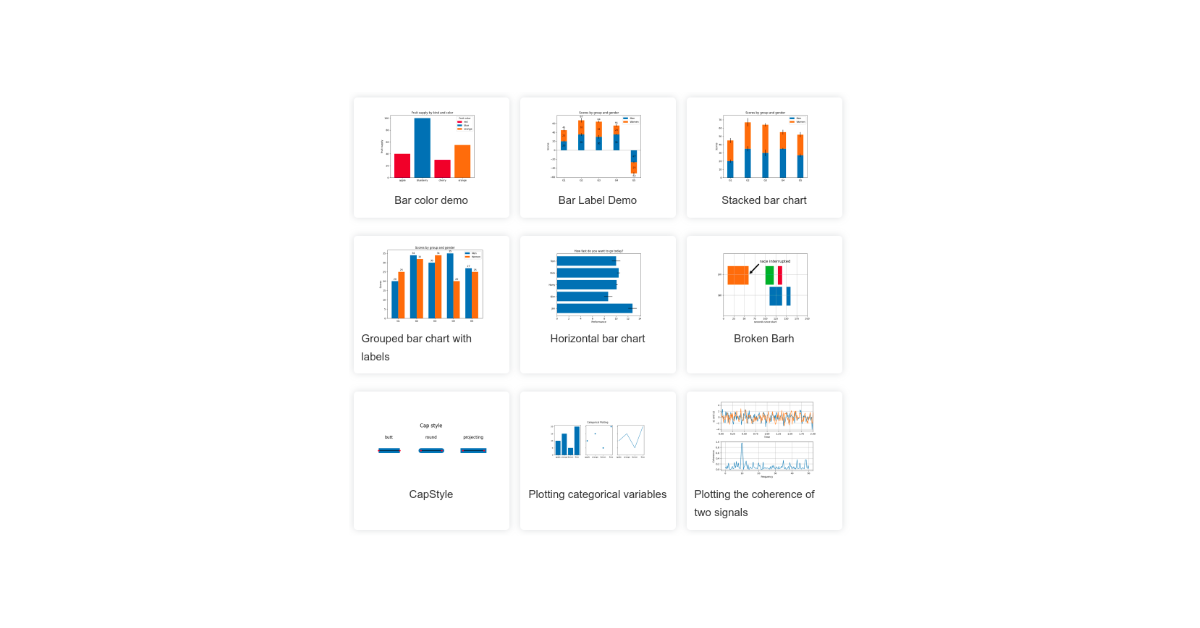
With Matplotlib, you can create a wide range of static, animated, and interactive visualizations in Python. Some examples of what you can do with Matplotlib include:
- Creating line plots, scatter plots, and bar plots to visualize relationships between variables
- Creating histograms to visualize the distribution of a single variable
- Creating pie charts to visualize proportions or percentages
- Creating error bars to visualize uncertainty or variability in data
- Customizing the appearance of your visualizations by changing colors, fonts, and other visual properties
- Matplotlib also provides extensive support for customization and styling, allowing you to fine-tune the appearance of your visualizations to suit your needs.
How do you get started with Matplotlib?
Getting started with Matplotlib is easy! To install Matplotlib, simply run the following command:
pip install matplotlib
Then, to import Matplotlib and use its functions, simply include the following line at the top of your Python script:
import matplotlib.pyplot as plt
From there, you can use the functions provided by Matplotlib to create visualizations of your data. For more detailed information on how to use Matplotlib, you can refer to the official documentation and tutorials available on the Matplotlib website.
And, finally!
In conclusion, Matplotlib is a powerful library for data visualization in Python. With its extensive capabilities and user-friendly interface, Matplotlib is a popular choice for creating visualizations of data in the field of data science.
Whether you are a beginner looking to get started with data visualization in Python or an experienced practitioner looking to expand your skills, Matplotlib offers a wealth of tools and resources for creating beautiful and informative visualizations of your data.
We hope this article has provided a helpful introduction to Matplotlib and that you will give it a try in your own data science projects.


